Technical Indicators in Forex Trading: Your Guide to Smarter Trades

What Are Technical Indicators?
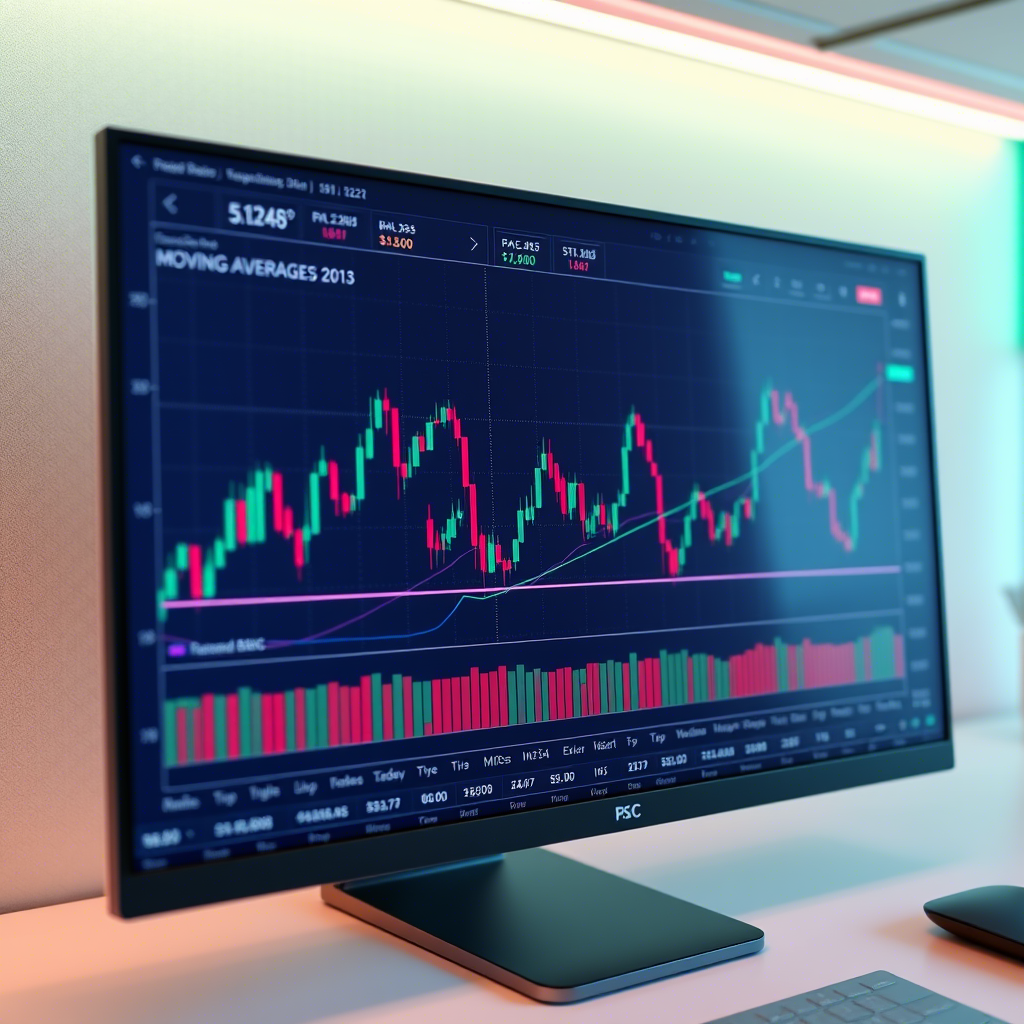
Technical indicators are mathematical formulas applied to price and volume data to generate visual signals on forex charts. They help traders interpret market trends, momentum, volatility, and potential reversals. Available on platforms like MetaTrader 4 (MT4), MetaTrader 5 (MT5), or TradingView, indicators simplify complex price data into actionable insights.
Think of technical indicators as a trader’s compass, guiding you through the market’s ups and downs by highlighting patterns and probabilities. While no indicator guarantees success, they enhance decision-making when used correctly.
Why Technical Indicators Matter in Forex
Technical indicators are a cornerstone of forex trading for several reasons:
-
Simplify Price Analysis: They distill raw price data into clear signals, making trends easier to spot.
-
Guide Entry and Exit Points: Indicators help pinpoint optimal times to buy or sell.
-
Measure Market Conditions: They reveal momentum, volatility, or overbought/oversold states.
-
Support Strategy Development: Indicators form the backbone of many trading systems, from scalping to swing trading.
-
Reduce Emotional Bias: Data-driven signals help traders avoid impulsive decisions.
By mastering indicators, you can navigate the forex market with greater confidence and precision.
Types of Technical Indicators
Technical indicators fall into four main categories, each serving a unique purpose. Here’s a breakdown:
1. Trend Indicators
Purpose: Identify the direction and strength of a market trend (up, down, or sideways).
Examples:
-
Moving Averages (MA): Smooth price data to show trends. Simple Moving Average (SMA) averages prices over a period (e.g., 50-day), while Exponential Moving Average (EMA) prioritizes recent prices.
-
Average Directional Index (ADX): Measures trend strength (above 25 indicates a strong trend).
Use Case: A bullish crossover (e.g., 20-day EMA crossing above 50-day EMA) signals a potential buy.
2. Momentum Indicators
Purpose: Gauge the speed and strength of price movements, often signaling reversals.
Examples:
-
Relative Strength Index (RSI): Ranges from 0 to 100, with readings above 70 (overbought) or below 30 (oversold) indicating potential reversals.
-
Stochastic Oscillator: Compares closing prices to a price range, highlighting overbought/oversold conditions.
Use Case: An RSI below 30 on EUR/USD might suggest a buying opportunity.
3. Volatility Indicators
Purpose: Measure the magnitude of price fluctuations, identifying breakout or consolidation phases.
Examples:
-
Bollinger Bands: Plot bands around a moving average, widening during high volatility and contracting during low volatility.
-
Average True Range (ATR): Quantifies volatility by measuring price ranges.
Use Case: A breakout above the upper Bollinger Band could signal a strong upward move.
4. Volume Indicators
Purpose: Analyze trading volume to confirm price movements (less common in forex due to decentralized data).
Examples:
-
On-Balance Volume (OBV): Tracks volume to confirm trends (rising OBV supports an uptrend).
-
Volume Weighted Average Price (VWAP): Shows the average price weighted by volume.
Use Case: High volume during a price breakout strengthens its validity.
Popular Technical Indicators for Forex
Let’s explore some widely used indicators and how they’re applied in forex trading.
1. Moving Averages
How It Works: A 50-day SMA smooths price data, while a 20-day EMA reacts faster to recent changes. Crossovers (e.g., short-term MA crossing above long-term MA) signal trend changes.
Application: On USD/JPY, a bullish EMA crossover on a 4-hour chart might prompt a buy trade.
Best For: Trend-following traders.
2. Relative Strength Index (RSI)
How It Works: RSI measures momentum on a 0-100 scale. Divergences (e.g., price rises but RSI falls) can signal reversals.
Application: If GBP/USD shows RSI below 30 on a daily chart, it may indicate a potential bounce.
Best For: Swing traders seeking reversals.
3. Bollinger Bands
How It Works: Bands widen during volatility and narrow during consolidation. Prices touching the upper/lower band may signal overextension or breakouts.
Application: A breakout above the upper band on EUR/GBP could trigger a buy with a volatility-based stop-loss.
Best For: Day traders and scalpers.
4. MACD (Moving Average Convergence Divergence)
How It Works: Plots the difference between two EMAs, with a signal line for trade triggers. A bullish crossover (MACD line above signal line) suggests buying.
Application: On AUD/USD, a bullish MACD crossover on a 1-hour chart might indicate an uptrend.
Best For: Trend and momentum traders.
5. Fibonacci Retracements
How It Works: Plots levels (e.g., 38.2%, 61.8%) based on a price move to identify potential support or resistance.
Application: On USD/CAD, a pullback to the 50% Fibonacci level could be a buy zone.
Best For: Traders combining indicators with price action.
How to Use Technical Indicators Effectively
Using indicators requires strategy and discipline. Here’s how to integrate them into your trading:
1. Combine Indicators
Pair indicators from different categories for confirmation:
-
Use a trend indicator (e.g., MA) to confirm direction.
-
Add a momentum indicator (e.g., RSI) to time entries.
-
Include a volatility indicator (e.g., Bollinger Bands) to gauge breakout potential.
Example: On EUR/USD, a 20-day EMA crossover, RSI above 50, and a Bollinger Band breakout could signal a strong buy.
2. Align with Timeframes
Choose timeframes based on your trading style:
-
Scalping: M5 or M15 charts with RSI or Bollinger Bands.
-
Day Trading: H1 or H4 charts with MACD and MAs.
-
Swing Trading: D1 charts with Fibonacci and ADX.
3. Confirm with Price Action
Indicators are tools, not guarantees. Use candlestick patterns (e.g., pin bars, engulfing candles) or support/resistance to validate signals.
4. Backtest Your Strategy
Test indicator setups in a demo account to assess their effectiveness. Track win rates and refine parameters (e.g., RSI period of 14 vs. 9).
Tips for Using Technical Indicators
Maximize your success with these practical tips:
-
Keep It Simple: Use 2-3 indicators to avoid analysis paralysis.
-
Practice in a Demo Account: Experiment risk-free to find what works.
-
Adjust for Volatility: Use wider stop-losses with volatile pairs like GBP/JPY.
-
Stay Updated: Align indicators with economic news (e.g., NFP) for context.
-
Review Performance: Log trades to identify which indicators suit your style.
Common Mistakes to Avoid
Steer clear of these pitfalls when using indicators:
-
Overloading Charts: Too many indicators create conflicting signals.
-
Ignoring Fundamentals: Indicators don’t account for news like rate hikes.
-
Relying on One Indicator: Single-indicator strategies lack confirmation.
-
Using Default Settings Blindly: Customize settings (e.g., MA periods) for specific pairs or timeframes.
-
Chasing Signals: Avoid late entries after an indicator signal has already played out.
Tools and Platforms for Technical Indicators
Leverage these resources for indicator analysis:
-
MetaTrader 4/5: Offers built-in indicators and custom options.
-
TradingView: Browser-based with advanced charting and community insights.
-
cTrader: Sleek design with extensive indicator libraries.
-
Broker Apps: Many provide proprietary platforms with indicator support.
Conclusion
Technical indicators are powerful tools that transform raw price data into actionable signals, helping forex traders navigate the market with precision. From moving averages to RSI and Bollinger Bands, each indicator offers unique insights into trends, momentum, and volatility. By combining indicators, aligning them with your trading style, and practicing disciplined risk management, you can boost your trading success. Start with a demo account, keep your charts clean, and pair indicators with price action for the best results. Dive into technical indicators today and take your forex trading to the next level!


